Project update | 24 January 2023
Sofia Darmaraki on her research trip to Plymouth Marine Laboratory
In late 2022 Sofia Darmaraki from the BOOMS project left the National & Kapodistrian University of Athens (NKUA) to spend several weeks at Plymouth Marine Laboratory where she joined other participants working on a method for sampling and clustering remote sensing data.
In this blog post she describes her experience and the research she worked on.
Vivid orange rays shined over the quiet garden the moment I arrived in front of the metal gate of PML. The cold morning air was hugging my face, while I was quickly making my way to the building. Once in the reception desk, a wave of warm air along with a smily lady welcomed me in my first visit. Something in the ambiance of that place elevated my excitement levels for the science that was happening inside. My first day involved an induction to the premises and regulations, with Kim kindly hosting me around. The more I was wandering the corridors of PML, the more I was looking forward to start this scientific journey, with the new, warm and friendly people I met already from the first day!
My mission for this research trip was to work on a method for sampling and clustering of remote sensing data. This is a vital part of the BOOMS project target of creating 3D dynamic seascapes in the ocean. Thanks to the insightful guidance of Thomas Jackson and Liz Atwood, I learned how to sample, temperature, chlorophyll-a and salinity data and how to cluster them together into groups of different characteristics. The sampling and clustering techniques involved data from the surface and deeper layers of the ocean, which can lead to the identification of 3D features of coherent physical and biological characteristics. These results will be incorporated to the novel seascape identification techniques that have already been developed as part of BOOMS and are based on optical water types and oceanic fronts.
The research performed in BOOMS is useful for the broader oceanographic community, since it will improve knowledge of oceanic provinces that can, in turn, inform biodiversity indices, and increase our understanding of topical scientific questions.
By Sofia Darmaraki
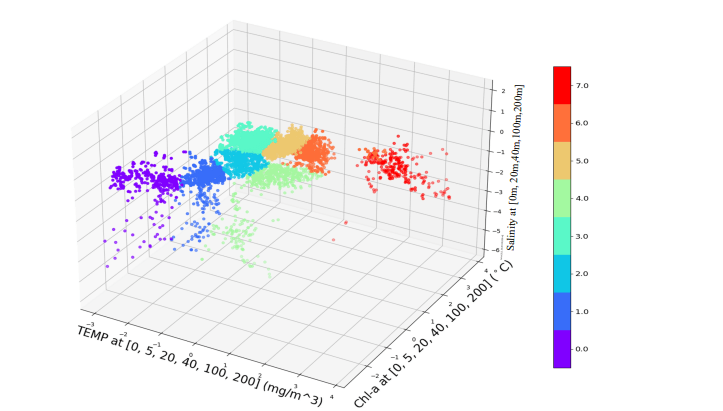 Fig.1: Example of 3D clustering of temperature, Chlorophyll-a and Salinity from various depths in the ocean (0m, 20m, 40m, 100m, 200m). Each color represents a different cluster. Data used are from Copernicus Marine Dataset: Multi Observation Global Ocean 3D Temperature Salinity Height Geostrophic Current and MLD.